EV/EBITDA는 기업의 가치를 영업이익(EBITDA)과 비교하는 재무 지표로, 기업의 수익성, 운영 효율성, 성장 가능성 등을 평가하는 데 유용합니다. 이 지표는 자본 구조와 회계 방식을 고려하지 않고, 순수하게 기업의 영업 활동에서 나오는 이익을 기준으로 기업 가치를 평가할 수 있게 해줍니다.
1. EV/EBITDA란?
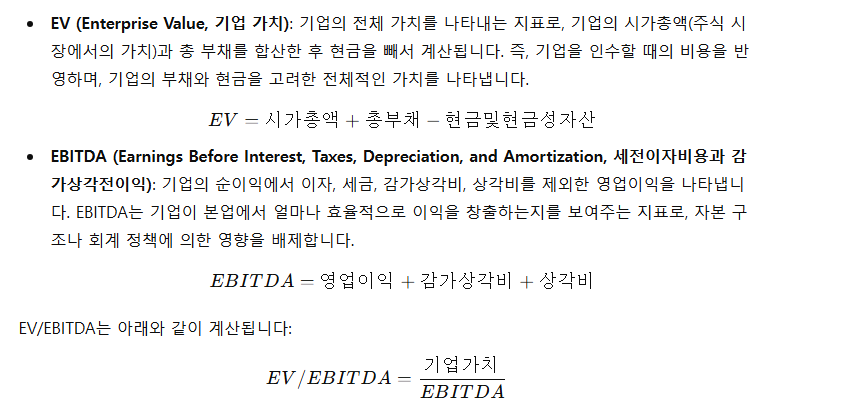
EV/EBITDA는 기업의 **기업 가치(Enterprise Value, EV)**를 EBITDA로 나눈 비율입니다. 두 가지 주요 개념을 설명하겠습니다:
2. EV/EBITDA 해석
- EV/EBITDA가 낮을 경우: 낮은 EV/EBITDA는 기업이 생성하는 영업이익에 비해 기업 가치가 상대적으로 낮다는 의미일 수 있습니다. 즉, 기업이 시장에서 저평가되고 있을 가능성이 있습니다. 반면, 이는 기업이 운영에서 효율적으로 이익을 창출하고 있다는 신호일 수도 있습니다.
- EV/EBITDA가 높을 경우: 높은 EV/EBITDA는 기업이 높은 시장 가치를 가지고 있거나, 시장이 해당 기업의 미래 성장 가능성을 높게 평가하고 있다는 의미일 수 있습니다. 그러나 지나치게 높은 비율은 기업이 과대평가되어 있을 가능성도 있으므로 신중히 해석해야 합니다.
3. EV/EBITDA 활용
- 기업 가치 평가: EV/EBITDA는 기업의 가치를 평가하는 데 유용합니다. EBITDA는 세금, 이자, 감가상각과 같은 항목들을 제외하므로, 기업 운영의 실제 이익을 반영합니다. EV/EBITDA를 통해 기업이 실제로 얼마나 효율적으로 영업 이익을 창출하는지를 평가할 수 있습니다.
- 업계 비교: EV/EBITDA는 동일 업계 내에서 여러 기업을 비교할 때 유용합니다. 기업마다 자본 구조가 다를 수 있지만, EBITDA를 사용함으로써 자본 구조와 관계없이 순수한 영업 이익을 기준으로 비교할 수 있습니다.
- 인수합병(M&A) 분석: 기업 인수 시 EV/EBITDA는 기업의 가치를 평가하는 중요한 지표로 사용됩니다. 매수자는 EV/EBITDA를 통해 인수 대상 기업이 지나치게 고평가되었는지 저평가되었는지를 판단할 수 있습니다.
4. 산업별 고려사항
- 산업 차이: EV/EBITDA 비율은 산업별로 다를 수 있습니다. 자본 집약적인 산업(예: 유틸리티, 통신)에서는 EV/EBITDA 비율이 낮을 수 있고, 기술 기반 성장 산업에서는 높은 EV/EBITDA 비율을 보일 수 있습니다. 따라서 EV/EBITDA 비율을 비교할 때는 같은 산업 내에서 비교하는 것이 중요합니다.
- 주기적인 변화: 경기 순환에 따라 기업의 EBITDA가 크게 변동할 수 있습니다. 이런 경우 EV/EBITDA는 일시적인 변화보다 안정적인 기업 가치를 파악하는 데 도움을 줍니다.
5. EV/EBITDA의 한계
- 자본적 지출을 반영하지 않음: EBITDA는 기업의 영업 이익을 기준으로 하기 때문에, 기업이 소모하는 자본적 지출(CapEx)을 반영하지 않습니다. 따라서, 자본이 많이 들어가는 산업에서는 실제 기업의 재정 상황이 더 복잡할 수 있습니다.
- 비현금 항목 제외: EBITDA는 감가상각비와 상각비를 제외하고 계산되기 때문에, 기업이 자산을 얼마나 효율적으로 활용하는지를 정확히 알 수 없습니다. 비현금 항목을 제외하면 일부 기업의 재정 상태를 과대평가할 수 있습니다.
- 부채 많은 기업: EV/EBITDA는 기업의 부채를 반영하지만, 부채의 질이나 상환 능력은 고려하지 않습니다. 과도한 부채를 가진 기업은 EV/EBITDA가 낮을 수 있으나, 실제로는 부채 상환이 어려운 상황일 수 있습니다.
6. EV/EBITDA와 다른 지표들
- P/E 비율 (Price to Earnings Ratio): P/E 비율은 기업의 주가와 순이익을 비교하는 지표입니다. EV/EBITDA는 순이익이 아닌 영업 이익을 기준으로 하여, 기업의 자본 구조와 관계없이 운영 효율성을 평가할 수 있다는 점에서 P/E와 차이를 보입니다.
- PBR (Price to Book Ratio): PBR은 기업의 주가와 순자산(Book Value)을 비교하는 지표입니다. PBR은 자산 측면에서 기업 가치를 평가하는 반면, EV/EBITDA는 기업의 영업 성과를 중심으로 평가합니다.
- 부채비율 (Debt to Equity Ratio): 부채비율은 기업의 총 부채를 자기자본으로 나누어 계산하는 지표입니다. EV/EBITDA와 결합하여 기업의 재정 건전성과 영업 효율성을 종합적으로 평가할 수 있습니다.
결론
EV/EBITDA는 기업의 영업 이익을 기준으로 기업 가치를 평가하는 유용한 지표로, 자본 구조와 회계 처리 방식에 관계없이 기업의 본질적인 가치를 파악하는 데 도움을 줍니다. 그러나 이 지표는 자본적 지출을 반영하지 않으며, 과도한 부채를 가진 기업에 대해서는 신중히 해석해야 합니다. 다른 재무 지표와 함께 종합적으로 분석하여 기업의 가치를 제대로 평가하는 것이 중요합니다.
EV/EBITDA is a financial ratio used to assess a company's value relative to its earnings before interest, taxes, depreciation, and amortization (EBITDA). It is a widely used metric in corporate finance and valuation because it provides insights into the company’s profitability, operational efficiency, and potential for growth while minimizing the effects of capital structure and accounting decisions.
1. What is EV/EBITDA?
EV/EBITDA compares a company's Enterprise Value (EV) to its EBITDA. Here’s how the two components are defined:

2. Interpreting EV/EBITDA
- Low EV/EBITDA: A lower EV/EBITDA ratio may indicate that the company is undervalued relative to its earnings, or it could suggest that the company’s operations are generating good profits in relation to its overall value. A low ratio could be a sign of an attractive investment opportunity, especially if the company is performing well operationally but trading at a low multiple.
- High EV/EBITDA: A higher EV/EBITDA ratio might indicate that the company is overvalued relative to its earnings, or that investors expect high growth or profitability in the future. However, if the ratio is excessively high, it may also signal that the stock is overpriced, and there could be potential for a market correction.
3. Uses of EV/EBITDA
- Valuation comparison: EV/EBITDA is often used to compare companies within the same industry, as it removes the effects of differences in capital structure (such as debt) and accounting methods (such as depreciation). This makes it a useful tool for comparing companies of varying sizes, financial structures, and accounting practices.
- Acquisition analysis: EV/EBITDA is frequently used in mergers and acquisitions (M&A) to determine how much a potential buyer should pay for a company. It helps investors and acquirers assess whether the target company is overvalued or undervalued based on its operational performance.
- Assessing profitability and efficiency: Since EBITDA reflects operational profitability without considering financing or non-cash expenses, EV/EBITDA provides a clearer picture of how well a company is generating profits through its core operations.
4. Industry Considerations
- Industry norms: The "ideal" EV/EBITDA ratio varies significantly by industry. Capital-intensive industries, such as utilities or telecommunications, tend to have lower EV/EBITDA ratios, while growth-oriented sectors, like technology, can have higher ratios due to future growth expectations. Thus, comparing EV/EBITDA ratios is most meaningful when done within the same industry.
- Cyclicality: Companies in cyclical industries may experience significant fluctuations in EBITDA over time. In these cases, the EV/EBITDA ratio can help smooth out temporary earnings fluctuations and provide a more stable basis for valuation.
5. Limitations of EV/EBITDA
- Doesn’t account for capital expenditures: While EBITDA is a useful measure of operational profitability, it doesn’t account for capital expenditures (CapEx), which can be significant for companies in capital-intensive industries. Therefore, a company with a high EV/EBITDA ratio might still require substantial investments in maintenance or expansion, which could affect its long-term profitability.
- Non-cash items: Although EBITDA excludes depreciation and amortization, it still includes non-cash income and expenses. This can sometimes distort the true financial health of a company.
- Debt-heavy companies: EV/EBITDA takes into account the company's debt, but it doesn’t necessarily reflect the quality of that debt or the company’s ability to service it. A company with a large amount of debt could have a lower EV/EBITDA ratio, but high levels of debt may still represent a risk.
6. EV/EBITDA and Other Metrics
- P/E Ratio (Price to Earnings): The P/E ratio compares a company’s stock price to its earnings per share. Unlike EV/EBITDA, P/E focuses on net income, which is affected by interest, taxes, depreciation, and amortization. EV/EBITDA, on the other hand, is less influenced by accounting and financing decisions, making it more useful for comparing companies with different capital structures.
- Price to Book (PBR): The PBR ratio compares a company’s stock price to its book value. While PBR focuses on the company’s net assets, EV/EBITDA focuses on the operational performance of the business, giving a more earnings-focused perspective.
- Debt to Equity Ratio: This ratio compares a company's total debt to its shareholders’ equity. EV/EBITDA can complement the debt to equity ratio by giving a more comprehensive view of how the market values a company relative to its debt and earnings.
Conclusion
The EV/EBITDA ratio is a valuable tool for assessing a company’s valuation in relation to its operational profitability, providing a clearer picture of its financial performance without being influenced by financing structure or accounting policies. However, it should be used in conjunction with other financial metrics and industry comparisons to gain a fuller understanding of a company's value and investment potential.
'이것저것 공부하기 > 경제' 카테고리의 다른 글
| 매도세(Bearish)란? (3) | 2025.03.26 |
|---|---|
| 매수세(Bullish)란? (0) | 2025.03.25 |
| ROE (Return on Equity, 자기자본이익률) (1) | 2025.03.21 |
| PBR (Price to Book Ratio, 주가순자산비율) (0) | 2025.03.20 |
| PER(Price Earnings Ratio, 주가수익비율) (0) | 2025.03.19 |


